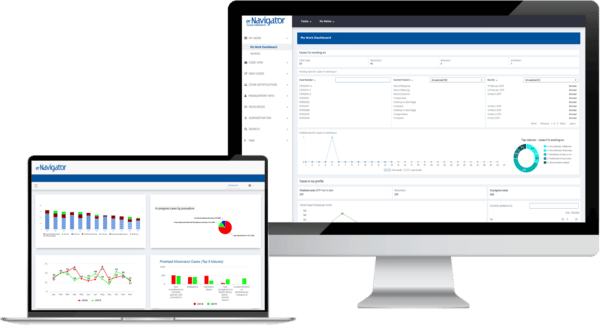
Create and share dashboards utilising real-time data in graphs, charts and tables to transform the management of labour and employee relations.
Combine this with erNavigator unique early detection risk monitoring and get notified when non-compliant actions occur.
Create and share dashboards utilising real-time data in graphs, charts and tables to transform the management of labour and employee relations.
Combine this with erNavigator unique early detection risk monitoring and get notified when non-compliant actions occur.
Create and share dashboards utilising real-time data in graphs, charts and tables to transform the management of labour and employee relations.
Combine this with erNavigator unique early detection risk monitoring and get notified when non-compliant actions occur.
Create and share dashboards utilising real-time data in graphs, charts and tables to transform the management of labour and employee relations.
Combine this with erNavigator unique early detection risk monitoring and get notified when non-compliant actions occur.
erNavigator centralises labour and employee relations data. All paper-based files are replaced with online files containing evidence and case and process histories, all available anytime, anywhere.
erNavigator provides enterprise grade data security and privacy compliant with GDPR and ISO27018.

A complete picture of all labour and employee relations activities in real time all in one place, with deeper insights that help end users make informed, data driven decisions.
A complete picture of all labour and employee relations activities in real time all in one place, with deeper insights that help end users make informed, data driven decisions.
Overall case volumes and statuses.
Unusual trends.
Compliance and consistency breaches.
Unusual case activity.
Unusual employee and manager activities.
Incorrect decisions.
Timing breaches.
Select key performance indicators to view pre-defined labour and employee relations metrics.
These KPI’s have been developed over many years of experience and offer a simple and quick view of trends, vulnerabilities and successes.
Here are some common erNavigator KPIs that you can work with when conducting analytics and reporting.
Select real-time reports to generate once-off requests quickly and easily for specific case or system usage information.


Select early detection risk monitoring to proactively monitor compliance, consistency and fairness.
Select real-time reports to generate once-off requests quickly and easily for specific case or system usage information.
It’s as simple as selecting a report from the available listings.
Select report parameters to filter the output.
Generate the report with real-time data.
Select analytics to interrogate data for a deeper insight.
The self-service analytics module allows end users to create their own striking data visualisations.
End users can design, view, customise and share reports in real time. In addition, reports can be automatically scheduled and delivered.
When creating new reports end users can select as many output fields as they require. Data modelling tools are available to present the data in alternative ways, including filtering, and separating.
Thereafter the end user can choose from the many flexible output formats available - charts, graphs, dials, reports, visualisations, summaries and much more.
Reports can be exported to several formats including Excel, Word, HTML, XML, PDF and CSV.
Select early detection risk monitoring to proactively monitor compliance, consistency and fairness.
Compliance with company policies and the law.
Consistency of decisions.
Fairness of outcomes.
Analytics is labour and employee relations data with analysis, information and insight that you can use to make informed decisions. Reports present information at the level of detail you requested.
Early detection risk monitoring automatically picks up non-compliance with company policies and the law as well as inconsistent decisions, as they happen so that immediate action can be taken. Reporting deals with matters that have already occurred.
Here are some of the common erNavigator KPI’s that you can work with when conducting analytics and reporting.
A business will use data analytics for several reasons, including finding patterns within datasets, analysing data from multiple silos in one easy-to-view dataset, monitoring business KPIs and identifying trends, thereby supporting informed decision-making with the most current information available.
Great reporting and analytics are only half the solution, they certainly help you make better decisions by showing present and historical data and identifying adverse trends. However only early detection risk monitoring will allow companies to proactively stop negative trends and actions from occurring in real-time.
This unique erNavigator combination of reporting, monitoring and analytics means that you can effortlessly analyse your labour and employee relations data to uncover insights into your workforce, policies and practices and automatically identify and stop negative trends and actions from happening.
| Cookie | Duration | Description |
|---|---|---|
| cookielawinfo-checkbox-analytics | 11 months | This cookie is set by GDPR Cookie Consent plugin. The cookie is used to store the user consent for the cookies in the category "Analytics". |
| cookielawinfo-checkbox-functional | 11 months | The cookie is set by GDPR cookie consent to record the user consent for the cookies in the category "Functional". |
| cookielawinfo-checkbox-necessary | 11 months | This cookie is set by GDPR Cookie Consent plugin. The cookies is used to store the user consent for the cookies in the category "Necessary". |
| cookielawinfo-checkbox-others | 11 months | This cookie is set by GDPR Cookie Consent plugin. The cookie is used to store the user consent for the cookies in the category "Other. |
| cookielawinfo-checkbox-performance | 11 months | This cookie is set by GDPR Cookie Consent plugin. The cookie is used to store the user consent for the cookies in the category "Performance". |
| viewed_cookie_policy | 11 months | The cookie is set by the GDPR Cookie Consent plugin and is used to store whether or not user has consented to the use of cookies. It does not store any personal data. |